Like many people, I’ve been using a lot of LLMs (Large Language Models, e.g. ChatGPT) recently. Unlike many people, I enjoy (and have the time for) reading textbooks and watching in depth YouTube videos on esoteric topics. Combining the two, I’ve spent much of the last two months tinkering around with and learning about ML/AI techniques.
While much of the current AI hype revolves around LLMs that generate human-like text or realistic images, classification problems (like identifying the subject of images) are another core use case for AI and these problems are common throughout the textbook linked above. Examples often help solidify my understanding (or show me that I really don’t understand what’s going on), so I began digging around for a problem I could repeatedly use to test my skills as I learn new techniques. Luckily for me, four friends and I have had a group chat for the last decade and Facebook Messenger provides a convenient message export. This provided me with a rich dataset of 56k text messages (+2k multimedia messages), each labeled with its sender.
This blog is the first in a many part series about me learning about classification algorithms, with a particular focus on Deep Learning. You can find the code I use for this series on Github. I’ll warn you in advance that I’m not sure how long each blog will take me or how many there will be. This first blog will cover getting the data into Python, cleaning it, writing some basic data structures, and doing some basic visualizations.
Group chat background
You might be thinking, “Wait, did you just say you have a decade-long group chat with over 50k messages?” Why yes, yes I did. These friends and I have known each other for a very long time (most of us for 25+ years) and have been using this group chat through graduations, weddings, births, moves, elections, Minecraft servers, startup ideas, etc., etc., etc.
To protect the privacy of these friends and to protect us all from any unsavory opinions of teenage me, I’m not going to be sharing the raw messages or the real names of the friends involved. That said, I’ll try to write the code in a message-agnostic way so that you can run it on your own messages if you so desire.
Ingesting and cleaning data
I won’t spend too much time here as it is rather routine, but tl;dr the Messenger export contains both a JSON log of all the messages sent with the message content, timestamp, and sender and all of the multimedia files (photos, gifs, stickers, videos, files, and audio files). The messages JSON doesn’t have a clear delineator of message type, so you need to use the presence of certain fields as an indicator of the message type and ingest it accordingly. Additionally, there are a couple system messages like “X changed the group’s photo” and “X reacted Y to your message” that I cleaned up and will exclude from most analysis.
I also found 3 messages that were outliers in terms of length and truncated them to the same length as the 4th longest message (1401 characters). The longest message was 17,880 emoji long (a repeating sequence of Russian and US flags)! I also discovered through this length analysis that emoji are represented in an odd way that I’ve so far been unable to properly parse. I won’t go into details here (maybe in a later post), but essentially the Messenger export uses an odd format (something to do with UTF-8 vs UTF-16 and \u vs \x). Maybe I’ll fix this later, but for now I’m just accepting that emoji look funny and will maybe cause us problems down the line.
This is probably not the end of the cleaning we’ll need to do. As we examine features and look at the messages more in depth, we’ll likely identify more things to clean. As they come up, I’ll try to mention them in future posts. If you want the full ingest and cleaning code (which will be updated as we go), you can find it here.
Basic data structures
Again, I won’t spend too much time here. I could have just used JSONs or dataframes, but loading messages in using a custom Message class allows some flexibility like defining sorting and printing behavior and adding functions to do things like extract features from the messages. As of now, I have a top-level Message class that contains the sender, content, and timestamp and the methods required for sorting (by timestamp) as well as two child classes - TextMessage and MultimediaMessage - that have a bit more functionality specific to those types of messages, like extracting features from a text message. In addition, to help with data ingest there is a factory method in the Message class that will take the json for a single message, parse it, and create a Message of the proper type.
You can find the Message, TextMessage, and MultimediaMessage code on Github.
Data vis
A full analysis would take much longer than I’m willing to give it and you all would get bored before I finished, so I’m just going to call out a few interesting trends I saw. To start, here are a few of the high level stats:
- Total Messages: 57856
- First Message Sent: 2013-04-27
- Last Message Sent: 2023-06-09 (We recently migrated from Messenger to Signal.)
- Days Between First and Last Message: 3696
- Days with at Least One Message: 2135
- Most Messages in a Day: 830
- Average Messages per Day: 15.65
- Average Messages per Active Day: 27.10
- Most Active Sender: Bean with 16125 messages
- Least Active Sender: Dink with 6793 messages
(In case you’re curious, the most heavily-messaged day was spent discussing shiny pokemon and making fun of each other for high school crushes.) I think the most noteworthy stat is the sheer volume of messages we sent. Over 15 messages a day for 10 years! Let’s see if that’s consistent over time by plotting the 30 day moving average of messages per day both in total and per sender:
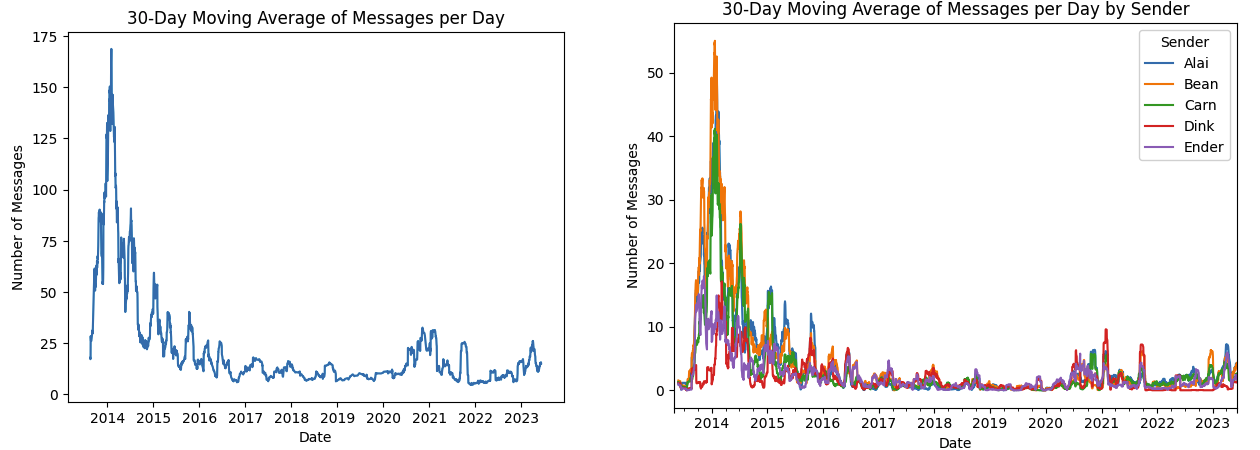
You can see from the first chart that we spiked pretty hard the first year of the group chat (while most of us were still in high school), then petered out a bit before a recent uptick around the time we started our covid book club. It’s hard to make out from the messiness of the second, per sender line chart, but if you squint you could hypothesize that the timing of the message (maybe days since group chat creation?) could be a feature to look at when we start classifying things. Speaking of classification, how hard of a problem will this be? In other words, how distributed is the overall spread of messages among senders?
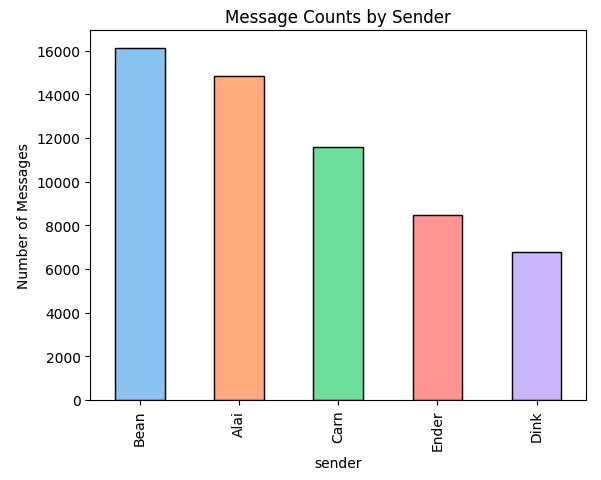
It’s not perfectly even (Dink has sent ~40% as many messages as Bean), but the proportions are close enough that I think it will be an interesting problem. This is confirmed by calculating the Entropy of the distribution. Read that link to better understand, but essentially entropy is a measure of how much uncertainty is intrinsic to our data set. Higher values of entropy mean the data are more random and thus harder to predict or classify. Using a log of base two (giving us the resulting entropy in bits), the entropy of our distribution is 2.25 compared to the maximum entropy (if the messages were equally distributed among senders) of 2.32, confirming that this is indeed a “hard” classification problem.
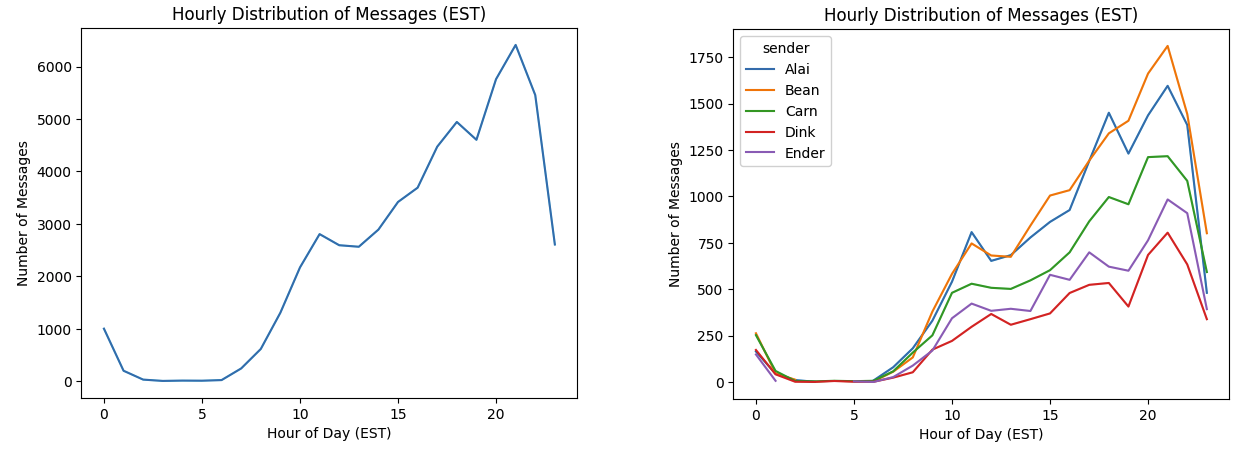
Looking at the hourly distribution of messages, we see that for the most part all senders are pretty consistent. We’re all most active in the evening (peaking around 9pm) and relatively inactive in the morning. Out of all the 50k messages, only 7 were sent between 3 and 4am ET and Dink and Carn are the only senders who have sent messages every hour of the day.
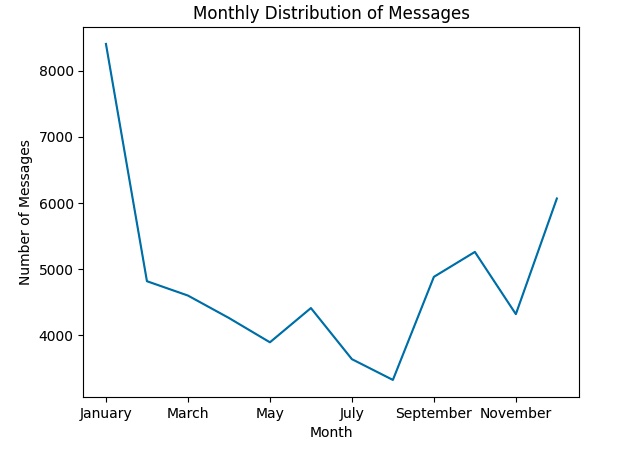
Looking at seasonal (monthly) trends we see a spike in activity in the winter months. This is partially caused by the large spike the first winter of the group chat, but you can also see the trend continue for many future winters, as well. December-January is a common time for high school/college kids to be mulling around without much to do, so it makes intuitive sense that these months would be the most active.
We now turn to something other than temporal trends. After removing punctuation and converting everything to lowercase to account for stylistic differences and removing common stop words (the, a, and, etc.) because they are boring, we can tally up and plot the most common words:
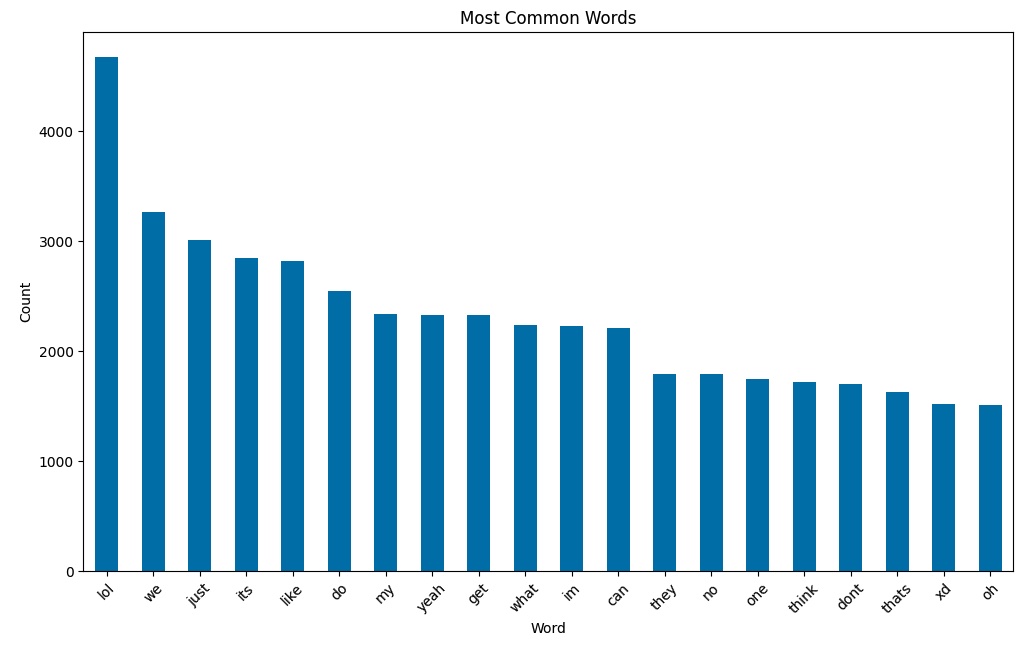
We are pretty boring as far as word choice goes, though apparently laugh a lot and had this chat before emojis were mainstream (XD). I tried a few other word/message analysis tricks like frequency of full messages and plotting message length and log of message length, but nothing stuck out. As I start to analyze the data more deeply to build models, I imagine we’ll get more advanced here.
Here’s the Jupyter Notebook I used in this section if you want to see some more of the analysis.
Conclusion
We’ve now loaded our data into a usable format and investigated the messages we’re working with at a high level. We saw some strong temporal message trends and noted a few other interesting stats like our love of lol.
In the next blog, I’ll go over how we will evaluate model performance and test out a very basic model or two on our dataset.